The Role of Geospatial Data in Smart City Transportation Planning
Geospatial data serves as a critical foundation for smart city development, particularly in enabling safe and efficient mobility. As Departments of Transportation (DOTs), Metropolitan Planning Organizations (MPOs), and municipal governments work to develop and maintain transportation infrastructure, assessing multi-modal accessibility and network connectivity becomes essential.
To evaluate the performance of existing transportation systems and adapt to evolving demands, urban planners and engineers rely on a centralized, accurate digital framework for strategic decision-making. Nazru AI partners with public and private sector transportation professionals to deliver high-precision, up-to-date mapping solutions tailored to mission-specific needs. While each community adopts its own approach to transportation mapping, the overarching objectives remain consistent: advancing smarter, safer, and more sustainable mobility.
The following examples demonstrate how AI-powered geospatial mapping provides communities with detailed vector layers to enhance transportation planning initiatives.
1. Planning for Active Transportation Systems
A sample of data created by Nazru AI for active transportation planning in San-Diego, California
Road-centerline
Sidewalk
Crosswalk
To promote healthier lifestyles and support sustainability objectives, municipalities worldwide are strengthening their investments in active transportation infrastructure. Well-developed, accessible networks not only foster equitable health benefits but also enable more environmentally friendly and cost-effective mobility solutions.
2. Pedestrian Right-of-Way Mapping
A sample of sidewalk and crosswalk data in Valladolid, Spain for pedestrian right-of-way mapping.
Sidewalk
Crosswalk
3. Pedestrian Right-of-Way Mapping
A sample of multimodal transportation network features in Germany, Eppinghofen.
Road
Pavement
Crosswalk
Raised-median
Slip-turn-lane
Driveway
Bridge
Forest
Left-turn-lane
Palnting-strip
Water
Sidewalk
Parking
Right-turn-lane
Stop-controlled-intersection
Sport-ground
Bareland
Grass
Stop-line
Signal-controlled-intersection
Building
Railway
Painted-median
Through-lane
Uncontrolled-intersection
Image
Mapping
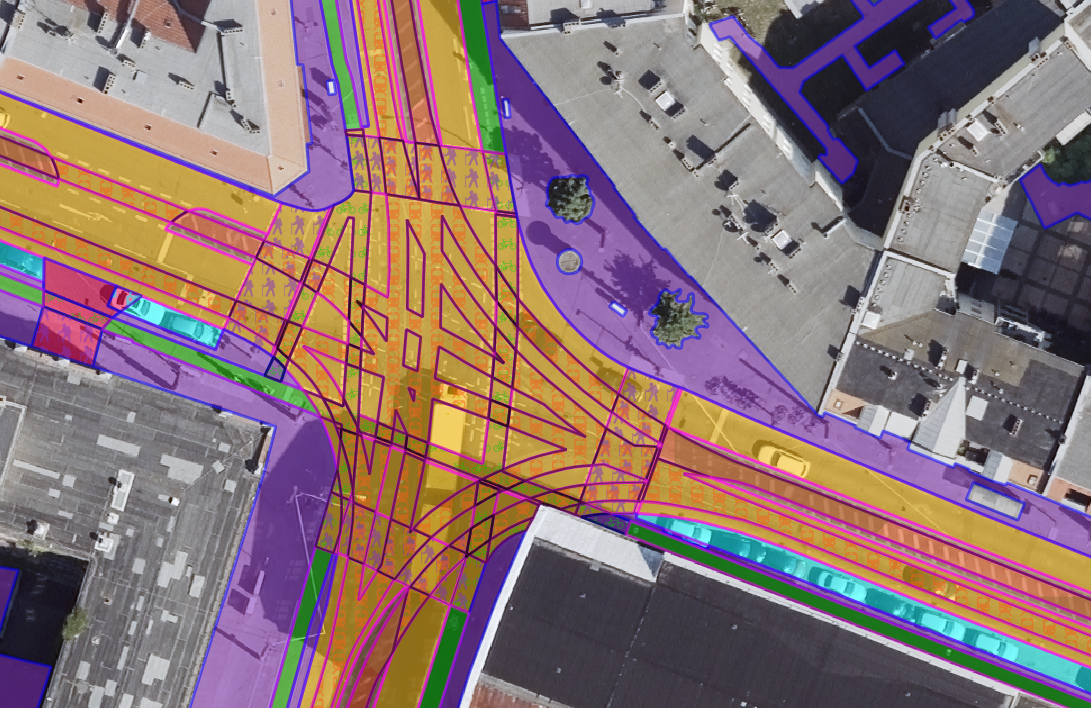
4. ADA Compliance
A sample of transportation mapping data used for ADA compliance in France, Paris.
Road-centerline
Sidewalk
Crosswalk
Bike-lane
Through-lane
Left-turn-lane
Right-turn-lane
Slip-turn-lane
Palnting-strip
The Americans with Disabilities Act (ADA) of 1990 was enacted to prohibit discrimination against individuals with disabilities, including specific provisions related to transportation. Consequently, transportation planning entities—both public and private—must integrate ADA compliance into their operational planning. For instance, ramps must be provided to ensure connectivity between sidewalks and other transportation infrastructure, while public transit stops must include adequate waiting areas for passengers. ADA compliance in transportation encompasses numerous considerations, with each region addressing distinct requirements based on its geographic and demographic characteristics.
In San Bernardino County, the largest county by land area in the contiguous United States, transportation planners from Fehr & Peers and the San Bernardino County Transportation Authority (SBCTA) utilize current geospatial data to assess network adherence to ADA standards. Given the county’s vast expanse (over 20,000 square miles), maintaining a comprehensive, manually updated database of transportation features is impractical.
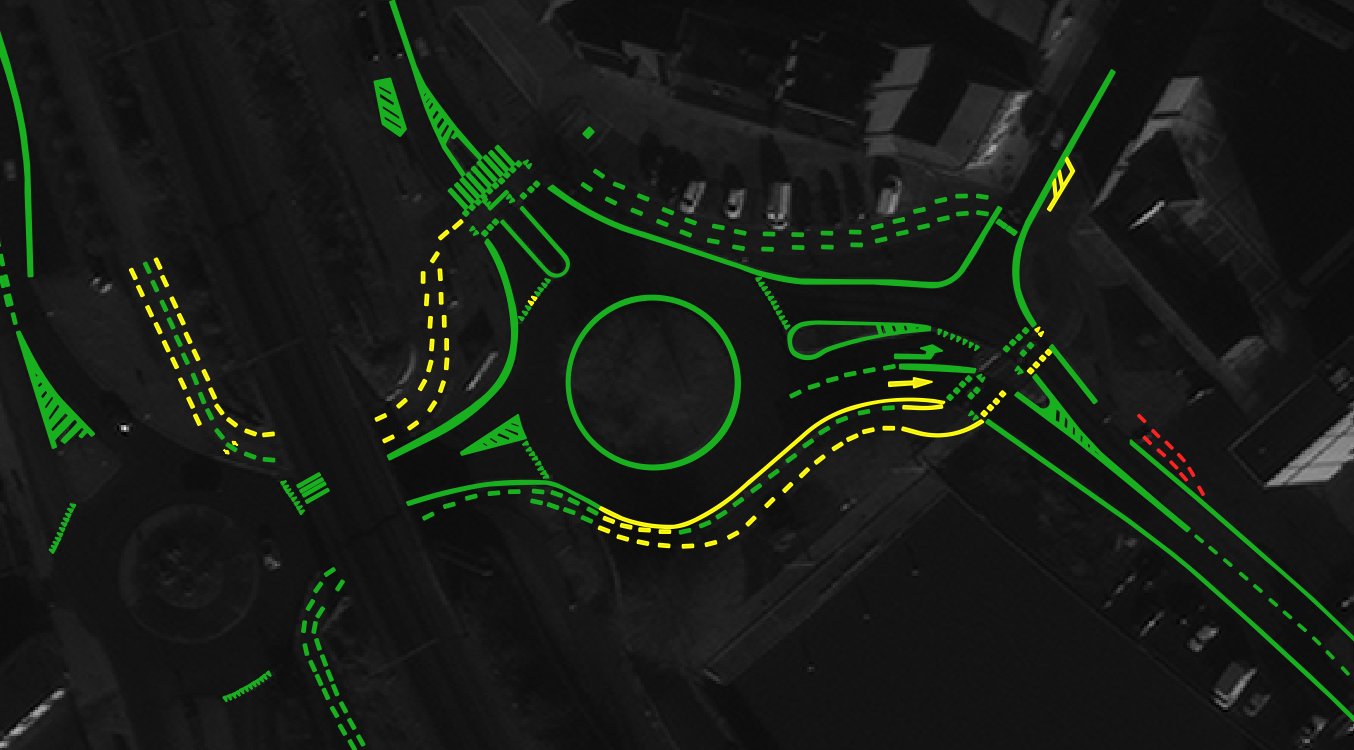
5. Vision Zero
A sample of transportation map features for Vision Zero planning in Freiburg im Breisgau, Germany
Intersection-signal-controlled
Sidewalk
Crosswalk
Bike-lane
Through-lane
Left-turn-lane
Right-turn-lane
Middel-turn-lane
Slip-turn-lane
Palnting-strip
Shoulder
Communities worldwide are increasingly adopting Vision Zero, a strategy designed to eliminate all traffic fatalities and severe injuries. A fundamental principle of Vision Zero is creating safer, more equitable transportation networks while promoting healthy alternatives to vehicle travel. Closely tied to active transportation planning, pedestrian right-of-way (RoW) mapping, multimodal network design, and ADA compliance, Vision Zero analysis and implementation rely on high-precision geospatial data.
Contra Costa County, California, is among the many jurisdictions globally committed to Vision Zero. To analyze past traffic fatalities and injuries, civil engineers at the Contra Costa County Department of Public Works integrate historical collision data with foundational transportation features from Nazru. The efficiency and accuracy of Nazru’s AI-powered vector layers enable engineers to maintain a real-time understanding of the county’s transportation infrastructure—without the need for costly, labor-intensive manual digitization. This approach allows Contra Costa County to swiftly identify traffic risks, implement targeted safety measures, and advance toward its Vision Zero goals.
Learn how Contra Costa County uses Nazru data to enhance road safety and reduce traffic incidents.
Get Started with Transportation Mapping Data
The examples above highlight just a few of the many ways NAZRU collaborates with transportation planners and civil engineers—across state and county agencies, as well as the private sector—to enhance infrastructure planning and safety.
Ready to leverage AI-powered transportation mapping data in your community? Contact our dedicated transportation team today. Our in-house licensed planner will work with you to identify the most relevant data layers for your needs and demonstrate how they can be applied to achieve your specific objectives.