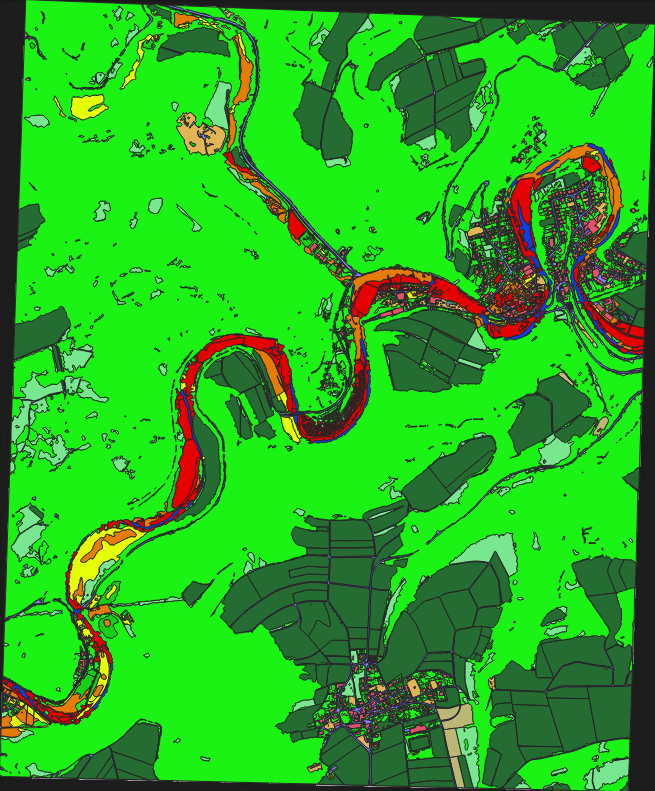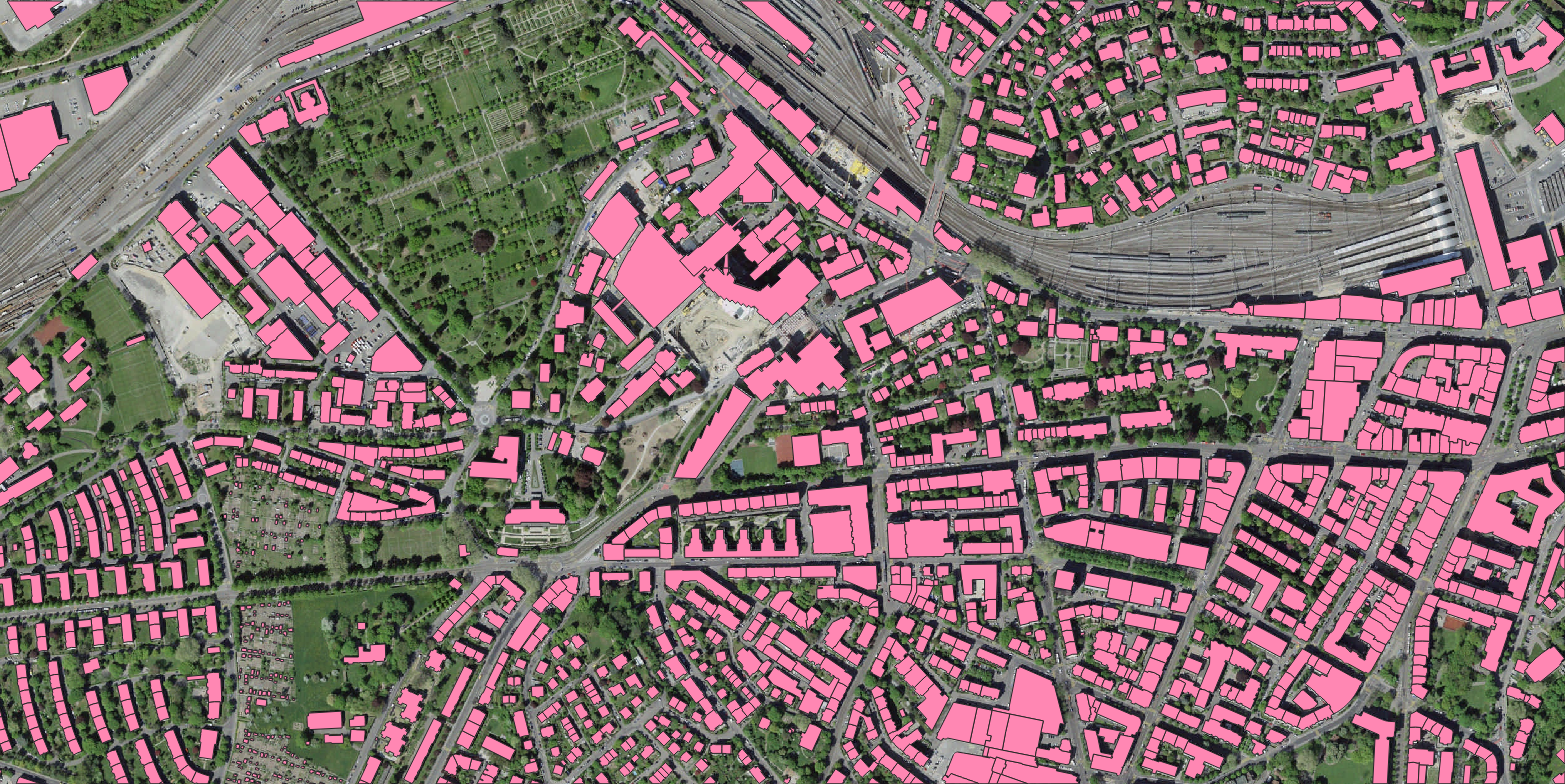
Flood Damage Assessment – Ahrweiler, Germany (Pre‑ & Post‑Event Satellite Imagery)
Location: Ahrweiler, Rhineland‑Palatinate, Germany
Event: July 2021 catastrophic flood
Imagery type: High‑resolution satellite imagery (pre‑flood and post‑flood)
Output format: Polygon (vector) – 16 classes × 4 damage levels
Project Overview
Nazru’s AI platform was deployed to assess flood‑induced damage over the Ahrweiler region using paired pre‑ and post‑event high‑resolution satellite imagery. The project classified the affected area into 16 distinct classes: building, roads‑and‑bridges, debris‑and‑waste, displaced‑population, rescue‑operations, topography, transportation‑hubs, utilities, vegetation, human, vehicles, water‑bodies, barren‑land, special‑spaces‑are, objects‑and‑artifact, and lane‑marking. For the post‑flood image, each class was further assigned a damage severity level from 1 (low) to 4 (critical). This multi‑level assessment supports disaster response, recovery planning, and infrastructure prioritisation.
The Challenge
The Ahrweiler flood of July 2021 caused widespread destruction, with entire streets washed away, buildings collapsed, bridges destroyed, and debris scattered across the valley. Assessing damage from satellite imagery in such a dynamic and chaotic environment presents several difficulties:
Visual ambiguity – debris and mud can resemble buildings or natural topography.
Temporal change detection – distinguishing flood‑induced changes from normal seasonal variations or pre‑existing conditions.
Damage severity estimation – assigning a consistent 1–4 level across 16 diverse classes requires careful interpretation and multi‑sensor validation.
Displaced population and rescue operations – these are dynamic, event‑specific classes that are difficult to capture in a single satellite frame but critical for humanitarian assessment.
Utilities and transportation hubs – assessing damage to buried or elevated infrastructure requires inference from visible surface signs.
The Nazru Solution
Nazru’s platform used a change detection + classification pipeline over the paired pre‑ and post‑flood images:
Pre‑processing – orthorectification, atmospheric correction, and precise image co‑registration (sub‑pixel alignment) between pre‑ and post‑event images.
Change detection – pixel‑wise difference analysis (NDVI, NDWI, and texture changes) to highlight anomalous areas.
Classification (pre‑flood) – mapping of 16 classes in the pre‑event image to establish baseline conditions.
Classification (post‑flood) – mapping of the same 16 classes, with an additional damage severity level (1–4) assigned per class:
Level 1 (Low): Minor damage – e.g., roofs partially exposed, light debris.
Level 2 (Moderate): Significant damage – e.g., roofs heavily damaged, roads blocked, vegetation loss.
Level 3 (Severe): Major structural damage – e.g., collapsed buildings, bridges destroyed, large debris accumulation.
Level 4 (Critical): Complete destruction – e.g., washed‑away structures, total infrastructure loss, impassable zones.
Post‑processing – polygon vectorisation with class and damage level attributes.
Damage analytics – generation of per‑class damage statistics (count, area, severity distribution).
Class definitions (contextualised for the Ahrweiler flood):
| Class | Description |
|---|---|
building | Residential, commercial, and public buildings – damage assessed by roof condition, wall collapse, or total loss |
roads‑and‑bridges | Road networks and bridges – damage assessed by road integrity, bridge collapse, or washout |
debris‑and‑waste | Accumulated debris, rubble, and waste materials – damage level indicates extent of debris spread |
displaced‑population | Temporary shelters, evacuation zones, or tent camps (inferred from satellite patterns) |
rescue‑operations | Areas with rescue teams, vehicles, or equipment (e.g., helicopters) |
topography | Changes in terrain (erosion, sediment deposition, landslides) – damage level indicates severity of change |
transportation‑hubs | Airports, train stations, bus depots – damage assessed by infrastructure condition and serviceability |
utilities | Power lines, water supply, sewage, and communication infrastructure – damage inferred from visible signs |
vegetation | Trees, crops, and natural vegetation – damage level indicates uprooting, burial, or dieback |
human | People visible in the imagery (rare, but detectable in high‑res imagery) |
vehicles | Cars, trucks, and emergency vehicles – damage level indicates cars submerged, destroyed, or displaced |
water‑bodies | Rivers, lakes, and floodwater extent – damage level indicates the extent and persistence of floodwater |
barren‑land | Land stripped of vegetation or topsoil by floodwaters |
special‑spaces‑are | Parks, squares, or recreational areas – damage level indicates flood debris, siltation, or destruction |
objects‑and‑artifact | Man‑made objects (e.g., containers, machinery) visible on the surface |
lane‑marking | Road markings – damage level indicates disappearance, burial, or preservation |
Key Results & Benefits
Comprehensive pre‑ and post‑flood land cover map with 16 classes, enabling direct change comparison.
Damage severity levels (1–4) per class, supporting prioritised recovery planning.
Quantitative damage assessment – area and count of features per damage level (e.g., 45% of buildings at Level 3 or 4, 12 km of roads at Level 3+, etc.).
Supports rapid disaster response – identification of rescue‑operation zones, displaced‑population locations, and critical infrastructure damage.
Facilitates recovery planning – detailed damage inventory for insurers, government agencies, and NGOs.
GIS‑ready – polygon outputs with
class,damage_level(1–4),area_m2, andconfidence.
Key Technologies Used
Change detection algorithms – NDVI, NDWI, texture differencing, and deep learning‑based semantic change detection.
Deep learning classification – U‑Net / DeepLabV3+ for pre‑ and post‑flood semantic segmentation.
Damage severity regression – multi‑level classification (1–4) integrated into the segmentation head.
Temporal co‑registration – image alignment to sub‑pixel accuracy.
Polygon vectorisation – clean, topologically correct polygons with multi‑attribute tables.
Output Format (Polygon per time‑step)
Pre‑flood:
Polygon layer (Shapefile, GeoJSON, KML)
Attributes:
class,area_m2
Post‑flood:
Polygon layer (Shapefile, GeoJSON, KML)
Attributes:
class,damage_level(1–4),area_m2
Optional output: Change map (polygons where class or damage level changed between time‑steps).