The Most Comprehensive Map of Buildings in Australia and Oceania by Nazru
In today’s rapidly evolving global landscape, a precise understanding of the built environment is a critical prerequisite for decision-making across numerous industries. Specifically, data on the location and dimensions of structures—known as “building footprints”—serves as foundational information for applications such as insurance risk assessment, telecommunications network planning and deployment, and municipal urban planning.
In this blog post, we will discuss the challenges and common pitfalls we have observed over the past decade in the pursuit of delivering best-in-class building footprints at a national scale. Furthermore, we will highlight how Nazru has overcome these obstacles to create and maintain the most comprehensive, accurate, and up-to-date building footprint map of the United States.
Challenges of Accurate Mapping at a National Scale
Compiling a complete and accurate dataset of building footprints for an entire country is a complex undertaking. The primary challenges can be summarized as follows:
1. Lack of Coverage and Comprehensiveness
Most high-value enterprise applications require a complete inventory of buildings across a given area of interest. However, many commercially available building footprint databases are incomplete. This is often because they are generated through methods such as:
Aggregating Fragmented Open Data: This approach involves scraping thousands of municipal and regional sources—many of which do not produce or release standardized building footprint data. The result is a partial database pieced together from sources of varying accuracy, detail, and recency.
Mining Low-Quality, Open-Source Imagery: This method involves mapping buildings from freely available geospatial imagery, which is often low-resolution and outdated—sometimes by several years. The sub-par level of detail and lack of recency leads to an incomplete and inaccurate representation of the actual built environment.
This example illustrates Nazru’s building footprints, depicted in green, overlaid upon the incomplete building footprints from a third-party provider, which were derived from outdated, lower-resolution open-source imagery.
2. Low Accuracy
Enterprise decisions are only as reliable as the data that informs them. Generating and maintaining highly accurate building footprints at scale necessitates robust artificial intelligence (AI) systems, scalable quality assurance (QA) protocols, and access to high-quality imagery. Many providers lack the necessary technological capabilities and imagery partnerships. Consequently, they are often unable to provide transparent accuracy specifications or may obscure performance by making broad, unsubstantiated claims—a concern illustrated in Figures 2 and 3.
When evaluating the accuracy of a building footprint dataset, the following metrics should be carefully considered:
False Negatives: The number of actual buildings that the system failed to detect, expressed as a percentage of the total number of buildings that should have been identified.
False Positives: The number of non-existent structures incorrectly identified as buildings, expressed as a percentage of the total number of buildings that should have been identified.
Interpretation Accuracy: The proportion of mapped footprints that are deemed a precise representation of the actual structures visible in the source geospatial imagery, expressed as a percentage of the total footprints delivered.
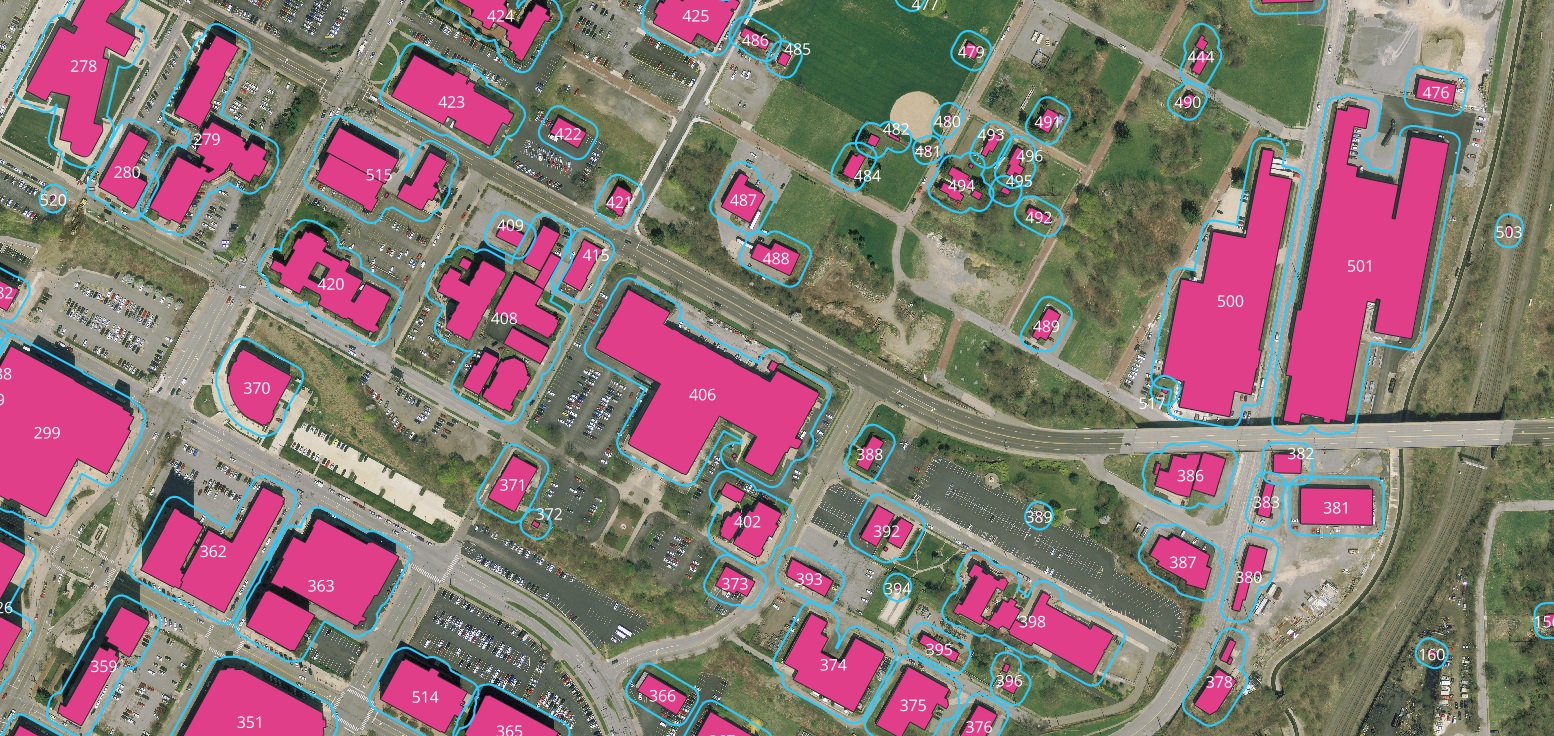
These examples contrast Nazru’s building footprints (green) with those from a third-party provider (red), demonstrating the latter’s inferior interpretation accuracy.
3. Out-of-Date Data
A significant challenge with many third-party building footprint sources is a frequent lack of transparency regarding their data update schedules. This opacity typically stems from reliance on inconsistent data acquisition methods, such as aggregating fragmented municipal data or mining open-source imagery. Providers using these approaches have little to no control over the frequency, quality, or comprehensiveness of updates.
For instance:
Municipal Data Scraping is entirely dependent on the budgeting, image capture, and production cycles of individual municipalities, which often provide updates infrequently, if at all.
Open-Source Imagery relies on the goodwill of imagery providers to donate updated imagery to the public domain. In our experience, due to the risk of revenue cannibalization, commercial imagery providers predominantly contribute outdated or lower-resolution imagery that holds minimal commercial value.
Consequently, datasets built from these sources can quickly become obsolete, failing to reflect new construction, demolitions, or alterations in the built environment.
Examples illustrating the higher accuracy of Nazru’s building footprints (green) compared to a third-party provider’s data (red), which is compromised by the presence of both false negatives and false positives.
A comparison of Nazru’s current building footprints (green) against outdated footprints from a third-party provider (red), which are based on obsolete open-source imagery.
Nazru’s Solution: The Most Comprehensive, Accurate, and Up-to-Date Building Footprints
Specific to the United States, Nazru has created and continues to maintain the preeminent database of building footprints with the following specifications:
Comprehensive
To ensure the most comprehensive coverage, Nazru first sourced the best commercially available high-resolution geospatial imagery across the contiguous United States (utilizing fresh <50cm aerial and satellite imagery). This imagery was then processed using Nazru’s AI-based system to create an entirely proprietary database of every building footprint larger than 100 square feet—including all sheds, townhouses, barns, and other permanent structures. The resulting database currently contains millions of building footprints across the world.
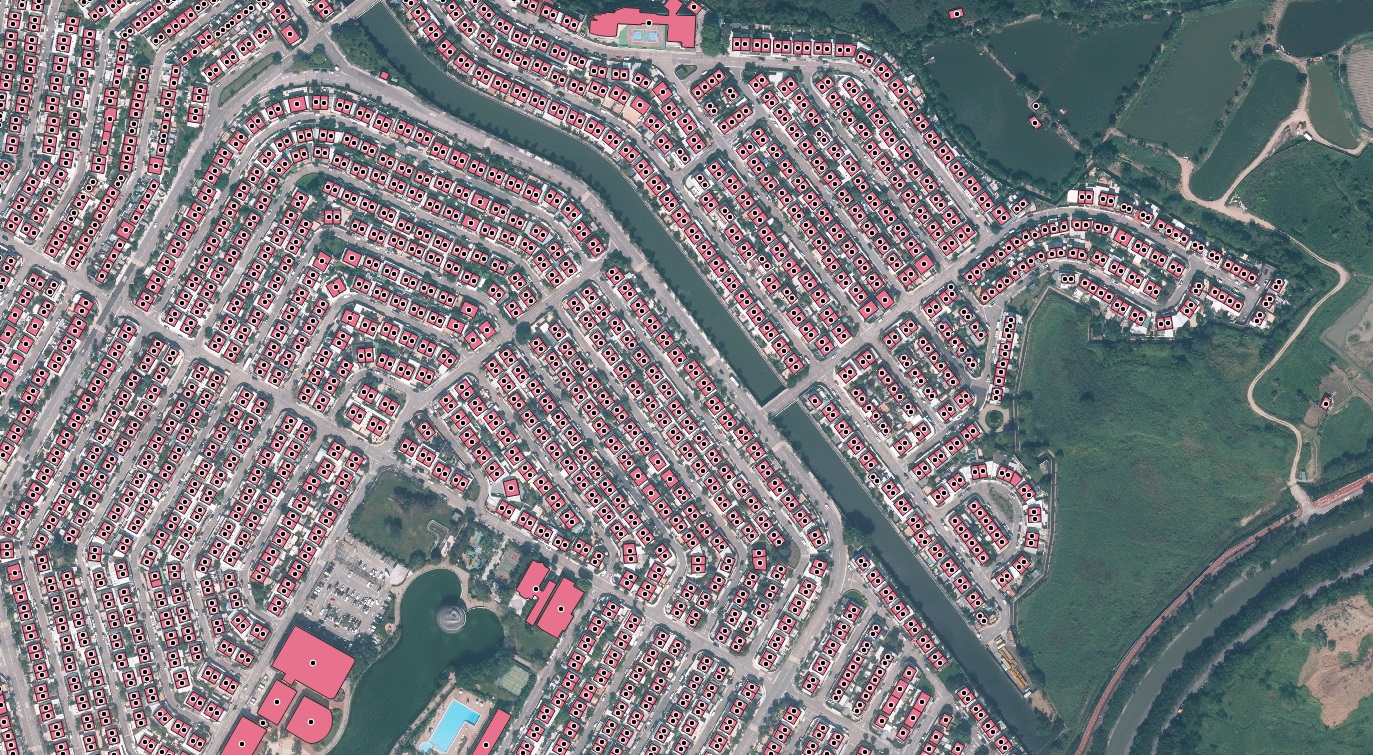
Nazru’s Building Footprints of the Australia and Oceania
Accurate
Nazru’s system iteratively integrates AI with rigorous quality assurance (QA) processes to analyze high-quality imagery. This technology, refined over the past decade, enables Nazru to consistently achieve and maintain industry-leading accuracy standards at scale.
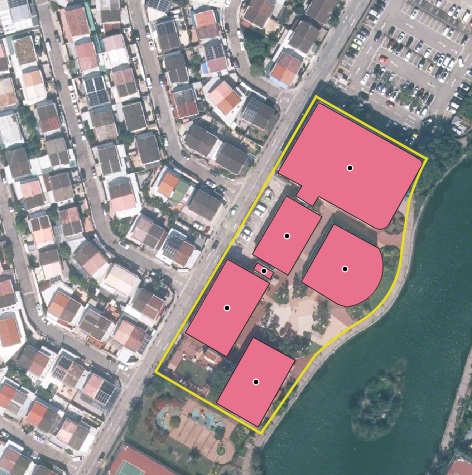
This example demonstrates the consistent accuracy of Nazru’s building footprints across structures of varying shapes and sizes.
Up-to-Date
Beyond maintaining an up-to-date map, this capability provides a unique perspective on all new construction, demolitions, and structural modifications across the country.
This visual analysis illustrates changes in Bern, swiss building footprints between 2018 and 2024 using Nazru’s data. The color coding is as follows: green for unchanged structures, blue for new construction, and pink for modified buildings.
In summary, effective enterprise decision-making requires a precise understanding of the built environment, for which building footprints serve as a foundational element. When investing in geospatial data, we recommend a diligent evaluation of the components outlined above to ensure your strategic decisions are informed by the most comprehensive, accurate, and up-to-date information available.
Interested in learning how Nazru’s building footprints can empower superior data-driven decisions within your organization? [Click here for a demo].